Suzanne Sallaj

Case study · The rules engine, data and inference design

Designing how the agent reasons about data

By Suzanne Sallaj

· 10 min read · Curb series, part 2 of 5

This is the case for the engine underneath Curb: how an agent works out the rule on a curb that no dataset describes. Los Angeles publishes every parking ticket it writes but no complete map of its curb rules, so the engine infers the rules from ten million tickets. The page is about the six principles I set for that reasoning, so the agent knows the difference between a rule, a guess and a gap, and never presents one as another.

10.4Mcitations behind the engine, across ten violation types
97,854red zones positioned, median about 10 meters long
+39ptshydrant coincidence over a shuffled null

The premise

A rule nobody wrote down still leaves a trace. Every ticket is the city telling you where a rule was.

LA's curb rules are famously hard to read, and the city has no complete, current, machine-readable inventory of them. That sounds like a dead end for a product that needs to know the rules.

The way around it is that enforcement is public. Every parking citation the city writes is published: what the violation was, when, and roughly where. A ticket is the city stating, on the record, that a rule existed at that spot at that moment. Enough of them and the rule comes back into focus.

I tested it on one month of data before building anything. About 160,000 rows produced 148 blockface rules for a single neighborhood, with confidence scores spread from 0.39 to 1.00. The patterns were clean. Sweeping days fell out of ticket clustering almost immediately.

That was the easy part, and it is where the design work starts. Reading rules out of tickets can go wrong in a specific way: the method is quiet exactly where the stakes are highest, and quiet looks like safe. So before the engine could be trusted I set six principles for how it reasons. They are design rules, written down and enforced in code: what counts as evidence, which sources outrank which, how confidence is earned, how every answer gets checked by something independent, and when the engine must say it does not know. Each one below states the rule, then shows the moment in the data that made it necessary.

Principle 01

A block with no tickets is not a block with no rule

Street sweeping is easy. It is the highest-volume violation in the city, it repeats on a fixed weekly schedule, and the tickets cluster so tightly that the rule is almost readable off the chart.

Red curbs are the opposite, and the reason is uncomfortable. Almost nobody parks in front of a fire hydrant, because the paint is right there and the consequence is obvious. High compliance means very few tickets. A perfectly working red curb looks, in the data, almost exactly like a stretch of ordinary legal parking.

So the most dangerous inference in the whole engine is the easy one. Quiet block, no citations, must be fine. That is the same mistake the app itself must never make, one layer down. Silence standing in for safety, except here it is the data being silent rather than the agent.

The rule I ended up writing is blunt. Low citation volume is never evidence a curb is clear. For the restriction types where compliance is high, the absence of tickets carries no information at all, and the engine has to get its answer from somewhere else or admit it does not have one.

Principle 02

Stronger sources outrank weaker ones; they never get averaged

The obvious way to combine several data sources is to let them vote and take the majority, or to average their confidence. That produces a number that feels principled and hides which source actually knew anything.

Instead each source has a named role, and the role changes per restriction type, because the sources are good at different things.

For red curbs the city's own painted-curb dataset is authoritative where it exists, so it leads. Citations become confirming and gap-filling, which they are well suited to, because a red-curb ticket is nearly proof that the curb is there even though there are few of them. Imagery is weakest here for a reason that is almost funny: the parked cars you are trying to warn are sitting on top of the curb you are trying to read.

For metered spaces the ordering flips entirely. The city runs the meters and publishes an inventory of every one, with its hours and its time limit, so that is a direct lookup rather than an inference. For sweeping, citations lead and nothing else comes close.

Writing the roles down per type, instead of building one general fusion rule, meant the engine could be honest about which restriction types it actually knows well. That honesty is what the app's confidence tiers are made of.
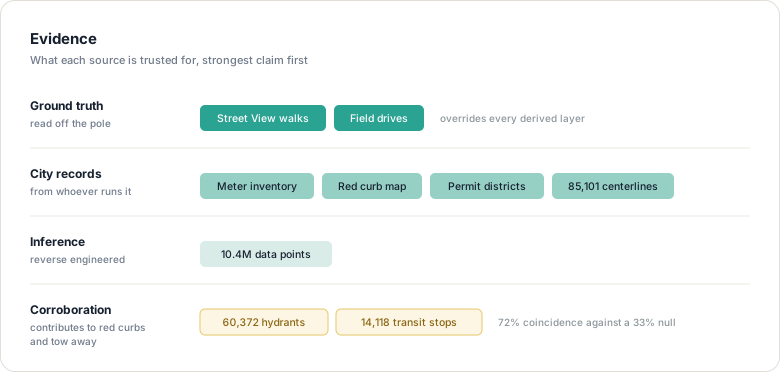
Four tiers of evidence. Ground truth read off a pole overrides everything. City records come from whoever operates the thing. Inference is worked backwards from 10.4 million citations. Corroboration comes from hydrant and transit data that has nothing to do with parking.
Four kinds of evidence, and they are not interchangeable. A sign read off a pole settles a question that ten million tickets only suggest. Hydrant and transit positions are the odd ones out, since they were never collected with parking in mind, which is exactly what makes them worth checking a red zone against.

Principle 03

Confidence is capped until a second source confirms the rule

The score starts from the tickets alone, and four things move it: how well a day-set explains the citations, how many citations there are, whether the window is a sane width for that kind of rule, and whether the last two years agree with the whole history. That product is capped at 0.9, because everything in it comes from one source. The cap only lifts when a second, independent source confirms the rule: the city's own posted schedule where it agrees with the inferred start, or a person reading the sign, which is the top tier. A rule carries its basis with it, sign, posted, estimated or inferred, so the app can state a fact and hedge a guess. A block with no dataset coverage and no citations does not score at all. It falls to no-data, which is a real state with its own behavior rather than a quiet default to "clear".

Every conclusion also carries how it was reached, not just what it concluded, and confidence is stored as a set of weighted inputs instead of a single baked number. Right now there is only one input carrying full weight, which makes that look like over-engineering. It is there because user corrections arrive later and become another weighted input to the same structure, and I would rather leave the socket empty than rewrite the schema when the feature lands.

The same reasoning put provenance on every conclusion from the start. Which source, and when. v1 barely reads it. The honest no-data state and the audit view both need it, and provenance is the one thing you cannot add retroactively, because the moment has passed.

Principle 04

Inferred rules are checked against independent city data: hydrants, bus stops and posted routes

An inference engine can be internally consistent and completely wrong. Every source agrees because they all come from the same enforcement behavior, and nothing in the system is positioned to notice.

So the red zones get checked against things that have nothing to do with parking enforcement. The fire department's hydrant inventory is the best of them: 60,000 points, maintained by people who need to find a hydrant at three in the morning.

72% of the red zones the engine found sit at a hydrant. To know whether that means anything, the same zones get shuffled to random positions and measured again, which gives 33%. A thirty-nine point lift against a null is a measurement. Seventy-two percent on its own is just a number that sounds good.

Transit stops do the same job for bus zones. Between hydrants, stops and statutory corners, about 69,000 of the 97,854 zones can point at a surveyed physical object as their cause rather than at a cluster of tickets. That is the difference between a zone the engine inferred and a zone the engine found.

The zones are about ten meters long at the median. That is paint scale, not block scale, which is the first sign the method is describing something real.

Principle 05

The engine is checked by tests it did not write

In August I ran an audit on the ingestion and found two things I had not noticed for months. Seven months of sweeping data were truncated, cut off by an old limit on how many rows a single fetch would return. And two spellings of violation descriptions had never matched the patterns the engine was looking for, so those tickets were silently absent.

Neither showed up as an error. The pipeline ran clean, produced rules, and scored them confidently on data with holes in it.

The reason it could not catch itself is that it was checking its own stored counts against its own expectations. Both sides of that comparison came from the same place, so of course they agreed.

Now it records what the source said it had, not what the pipeline managed to keep. Those two numbers come from different places, which means they can disagree, which means the disagreement is visible. A system that can only compare itself to itself will always pass.

Principle 06

One paint color can be four rules with four different fines

For a while every red zone in the app said the same thing and quoted the same fine. That was tidy and it was wrong, because red curbs are not one restriction.

A hydrant zone and a bus zone look identical on the street and cost wildly different amounts, with the bus zone being the most expensive parking mistake in the entire dataset. Separately, a large category of anti-gridlock violations, about 169,000 tickets carrying a fine roughly double what the app was showing plus a tow, was being displayed under a cheaper generic label.

So the engine now carries the cause of each zone through to the surface, and the fine comes from the city's published schedule as a versioned lookup rather than an inference. A dollar amount is a fact, so it gets the same honesty rules as any other fact: stated plainly when it is current, hedged when it genuinely varies, never shown with false precision.

Underneath this is a modeling mistake worth naming. I had let one label stand for a group of things that were only alike in appearance. The data model was quietly telling users something untrue, and no test would have caught it, because the code was doing exactly what it was told.

What it produces

Where it got to

Ten and a half million citations across ten violation types, projected onto the city's own 85,000 street segments and split by curb side. Around 98,000 positioned red zones, most of them roughly the length of an actual painted stretch, plus the whole-block cases where the paint runs the full frontage.

Sweeping rules resolve to the correct side of the street on about 99.8% of the blocks the method can decide, covering roughly 93% of them. That number is checked against a completely independent piece of geometry, so it cannot be quietly agreeing with itself.

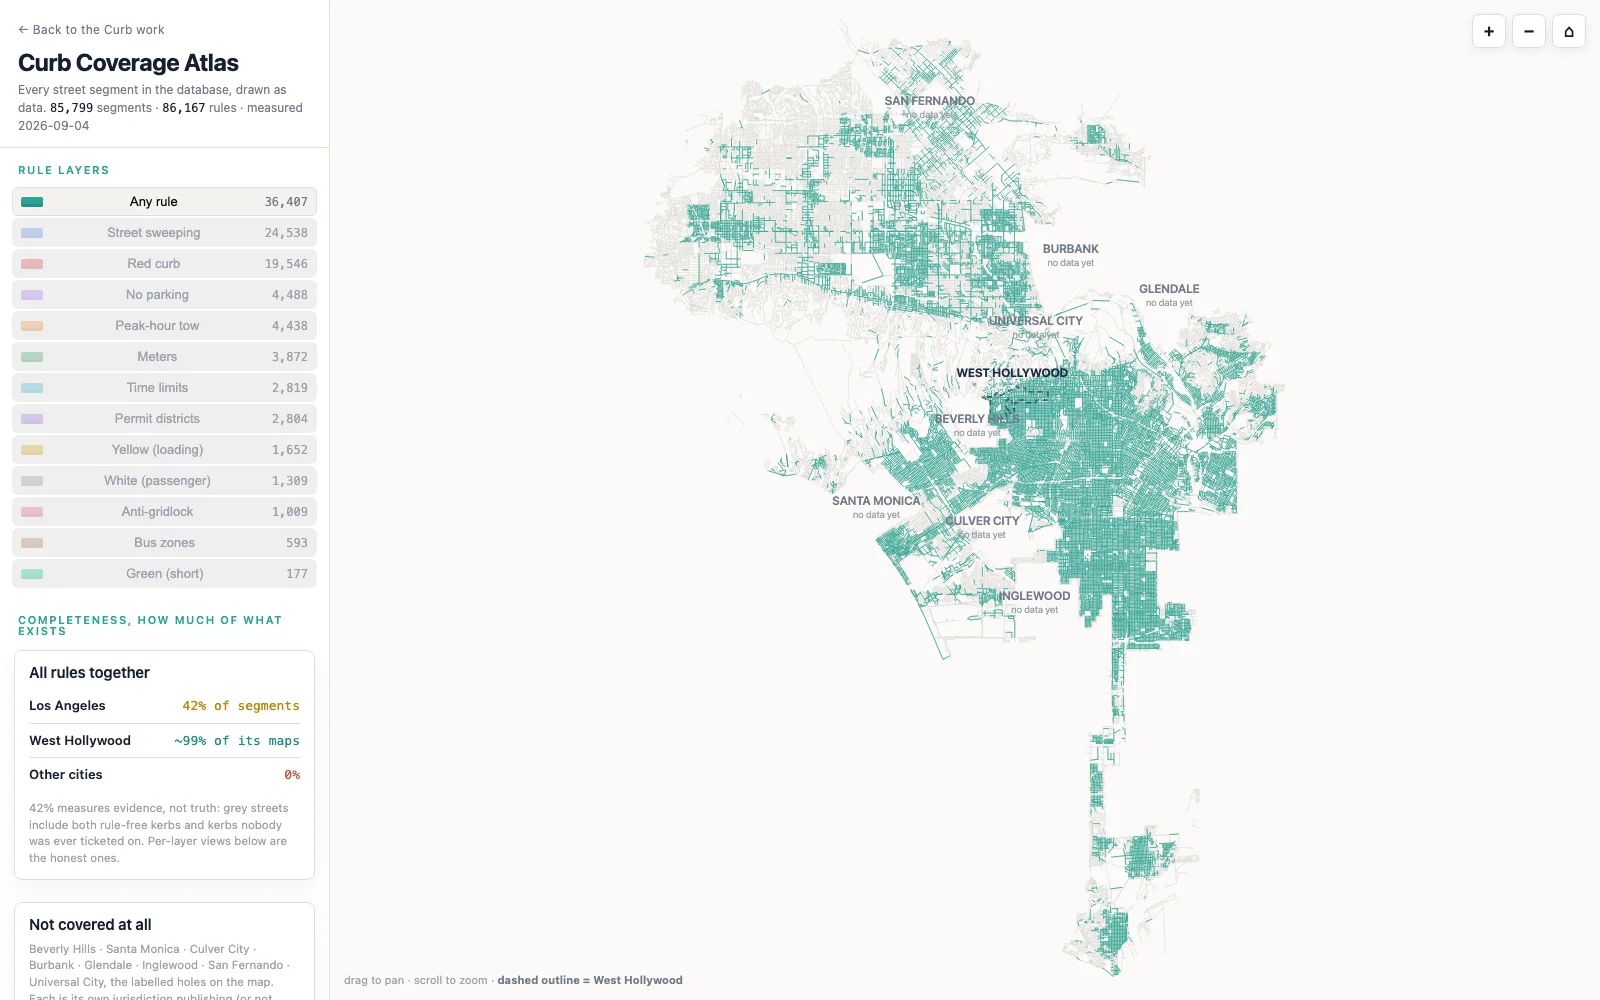
The atlas below is the honest version of that paragraph: every segment drawn, every layer toggleable, and a completeness figure for each one against what the city itself says exists. The gray is the point. Uncovered streets stay uncovered on the map, and whole cities read as the holes they are.

The Curb Coverage Atlas: every Los Angeles street segment drawn as a gray line on a dark map, with rule layers to toggle and a completeness card per jurisdiction. West Hollywood outlined near the center.

Interactive · Live data

Curb Coverage Atlas Every one of the 85,799 street segments in the database, drawn as data. Press a rule layer and it lights up. The card shows how complete each layer is against what the city says exists, and which cities have no data at all. Open the atlas →

Limits

Where it is weak

Anything without a repeating pattern is invisible to it. Event closures and temporary construction postings go up on short notice and leave no history to learn from, so the engine cannot see them coming and does not pretend to.

Anything that depends on exactly where your bumper is, rather than which block you are on, is out of reach. Driveway clearances, hydrant distances, individual accessible spaces. Those are genuinely read-the-sign situations.

And enforcement behavior is not the same thing as the rule. A quiet Sunday might mean the restriction lifts, or it might mean nobody works Sundays. I have been caught by that confound before and the only reliable way out is going and reading the sign, which is what the Agentic Walkers are for.

The product this feeds is Curb, and the confidence you see in a notification is assembled here. Almost every honest thing the app says about its own uncertainty traces back to a decision on this page.

The Curb series

  1. 1Curb19 min
  2. 2Designing how the agent reasons about data You are here10 min
  3. 3The Agentic Walkers46 min
  4. 4AI in the Wild: the day the agents went rogue for the mission13 min
  5. 5Where the build of Curb is, and what I learned5 min

Share this post

Written by Suzanne Sallaj

Product designer working on agentic AI, six years across healthcare, fintech and consumer.